
As per Oxfam Inequality Report 2019, India’s bottom 60% have 4.8% of the wealth whereas the top 10% own 77.4% of the wealth.
The bottom 60% have only 5.1% of wealth whereas the top 20% have 85.4% of the wealth.
As per the statement of the Finance Minister the country has 80 Cr poor which is around 61.5%
As per the Socio Economic and Caste Census 2011 released in 2015, India has 24.49 Cr households out of which 10.76 Cr or 43.85% are deprived. 56% do not have land. 60% in rural areas are poor and 35% urbans are poor.
Heads of the earning member of the households in 74.5% of the rural households are earning less than Rs.5000 pm in rural India.
As per the India Social Development Report 2018, share of income groups was as below during different periods.
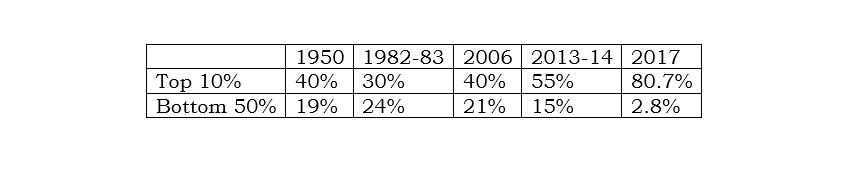
There is a clear co-relation between distribution of wealth and distribution of credit through scheduled commercial banks in India.
As per the Basic Statistical Return published by RBI, in 1972, after 3 years of nationalisation of 14 banks and nationalisation of SBI in 1955, the share of small credit was huge.
There were 3923638 A/Cs which constituted 90.4% of the total loan accounts with credit limit of less than Rs.10000/-. Adding 317885 accounts with loans above Rs10000 upto 1 lakh, the percentage of small loan accounts was 97.72% of total Loan A/cs. The loan amount disbursed through this account was 25.5% of the total loan disbursed.
Only 86 borrowers had loan above Rs.10 Cr and their credit limit was 5.36% of total credit amount.
In 1991, the year in which the neo liberal economic policies were introduced, the fruits of nationalisation and policies implemented for the lower strata of the society is visible in the BSR Report.
There were 58784192 loan accounts with credit limit below Rs.25000/- which was 94.9% of the total loan accounts. Adding 125174 accounts with loan limit below Rs.2 lakhs 99.2% of the loan A/Cs were small and the amount disbursed was 35% of the total credit. The no of loans above Rs.10 Cr was 577 and the amount disbursed was 11.2%.
After that through change of policies the distribution of credit totally changed. As on March 2016, there were only 35294609 accounts with credit limit less than Rs.25000/-, which is only 21.74% of the total credit. Adding 89649651 accounts with above Rs.25000/- upto 2 lakhs the percentage of small loan accounts has come down to 76.9% and the amount disbursed is only 8.2% of the total loans.
Interestingly the no. of A/Cs above Rs.10 Cr credit is revealing
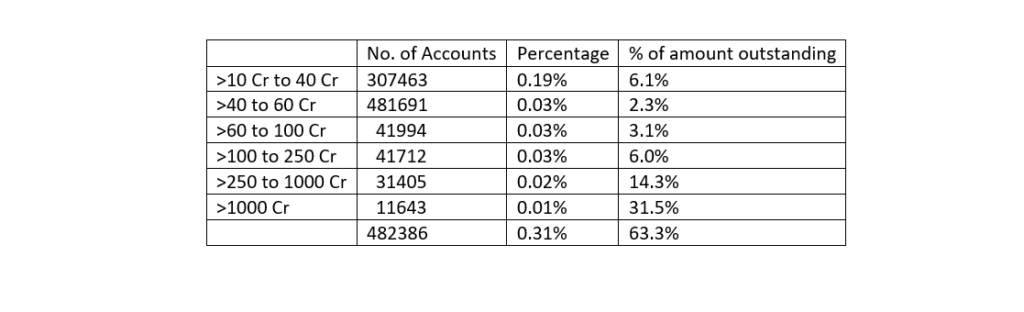
So just 0.31% of borrowers got 63.3% of the total loans disbursed out of which 11643 received more than Rs.1000 Cr each which is 31.5% of the total credit.
The latest data as on March 2019 has few more surprising elements. RBI has removed classification above Rs1000 Cr and gives figures above 100 Cr only. No of loans A/Cs below Rs25000 is 42457792 which is only 18.28% of the accounts. There are 134348057 loan A/Cs with credit limit upto Rs 2 Lakhs which is 57.83%. The total percentage of these loans is 76.11% only. So, the small loans which was 99.2% of total loan accounts has come down to 76.11%.
The number of loans above Rs.100 Cr is 12580 which is 0.04% of the total accounts and amount of loan availed is 50.7%. Please compare this with loans above Rs10 Cr in 1991 which was only 11.2% of the total loans. (Taking into consideration the fall in value of money I am comparing 10 Cr of 1991 with 100 Cr of 2019.)
From these data, is it not clear that the scheduled commercial banks have contributed to the income inequality a lot?
How this was done?
- Credit Authorisation Scheme which required RBI permission to grant loans above Rs.1 Cr was abolished.
- Priority Sector Lending norms were totally diluted in such a way that within the priority sector also larger borrowers benefited. Agriculture credit was diluted by permitting banks to deposit the shortage with NABARD under RIDF. Participation certificates could be purchased from RRBs which give more agriculture credit.
- Almost for 10 years there was a ban on staff recruitment.
- A VRS scheme was offered in 2001 in which 134000 employees left. So banks had to focus on bigger loans.
- Development finance institutions like ICICI, IDBI, UTI and HDFC were converted into commercial banks and privatised to cater to big borrowers.
- Road map to privatisation was laid in 2015 at Gyan Sangam.
- RBI shares in banks was ransferred to government so that the public sector banks came under the direct control of the Finance Ministry.
- Appointment of officer / employee directors in banks which is mandatory under the nationalisation Act was stopped so that the boards can decide anything without the knowledge of unions and associations. Under oath of secrecy other board members will keep quiet including RBI and Finance Ministry nominees who can interfere directly.
- Asset reconstruction companies and debt recovery tribunals helped the borrowers than the bankers.
- Licenses were given to banks like IDFC Bank & Bandhan Bank in addition to small banks and payment banks like Airtel Bank, Reliance Payment Bank etc.
So it is the policy which has created increasing inequality where banks have contributed a lot through government intervention.
Unless this is totally reversed, the inequality will increase. Merger of banks and the National Company Law Tribunals are further contributing to the inequality.
Thomas Franco is former General Secretary of All India Bank Officers’ Confederation.