
India’s pollution metrics fail to capture the complex reality of environmental degradation.
The city is fine, really. Right outside the railway station, beneath the board that says Asansol Junction, an LED panel displays the day’s air quality. Mostly, it reads ‘moderately polluted’ or ‘poor’ through the summer and monsoon months, and ‘very poor’ through the winters, but never ‘severe’. This seems like an achievement: Asansol, West Bengal’s second-largest city and my hometown, was categorised as one of the 43 ‘critically polluted’ industrial areas in India by the Union Ministry of Environment and Forest in 2009. In subsequent years, a number of efforts were put in place to curb pollution, including a brief ban on setting up new industries. All plants and factories were also required to install pollution-control devices and keep emissions within permissible limits.
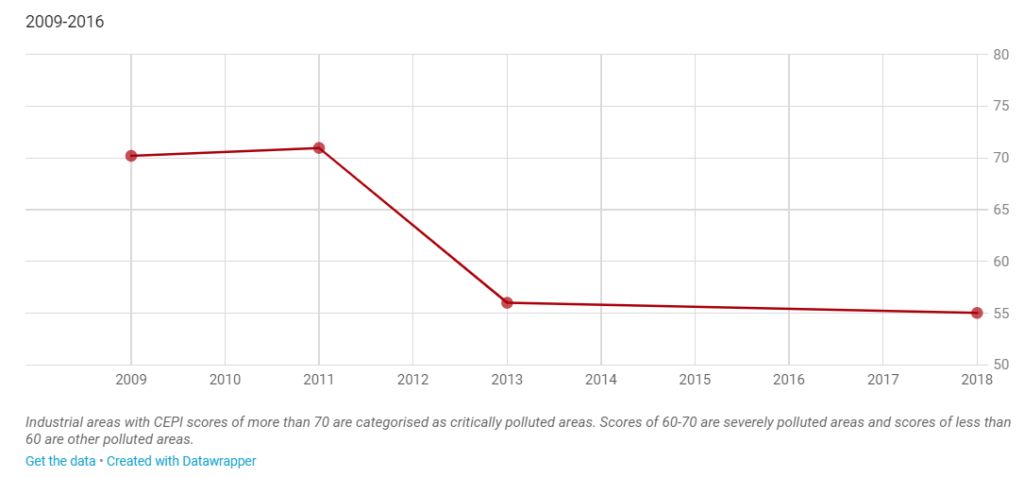
Available data suggests these efforts had an impact. Asansol’s score as per the Comprehensive Environmental Pollution Index (CEPI) – which measures air, water and land pollution on a scale of 0-100 and has been used since 2009 to measure environmental quality – improved significantly over the past decade. Asansol’s CEPI score dropped from 70+ in 2009 and 2011 (i.e. a critically polluted area) to 55.03 in 2018, indicating less than severe levels of pollution. (Asansol’s MP Babul Supriyo is also the union minister of state for environment, forest and climate change).
CEPI scores for Asansol
But it is only when you travel outside the city, along the numerous roads that lead into massive collieries within the Asansol Durgapur Development Area – spread over 1603 square kilometres, it comprises two municipal corporations, three municipalities and eight community development blocks – that you begin to see how mining is rupturing local ecology and causing irreparable damage to the environment. Long before you see the huge mounds of overburden (the term used to describe the rock, soil and other material lying above a coal seam, which must be removed before surface mining) from open-cast coal mines, you notice coats of dust and fly ash, produced by the burning of powdered coal, on everything in sight. The land, covered with dense forests till the 1980s, is mostly barren, dotted with innumerable brick kilns that are gobbling up all the topsoil around them, leaving behind pools of stagnant, putrid water.
The open-cast mines began springing up in large numbers starting in the 1980s, according to residents and environmentalists from the area. A couple of them resemble hill stations, with plateaus and peaks of varying heights and levels. Streams gush from prised-out rock seams, flowing through makeshift valleys and inundating coal beds being worked on by backhoes and bulldozers. Surely this is environmental degradation – there’s loss of forest cover and biodiversity, destruction of natural aquifers, depletion of groundwater resources, degeneration of topsoil from overburden runoffs and more.
“The impact of this oversight is not written in words; it is written, instead, in the bodies of those who live and toil here, in the trauma of lost habitats, chronic respiratory diseases, allergies and ailments, of which there is no registry or database.”
Yet the Comprehensive Environmental Pollution Index does not factor in any of this activity in the hinterland that would have a long-term impact on the environment. In fact, when Asansol was designated ‘critically polluted’ in 2009, only the area around the IISCO Steel Plant – which runs on coal drawn from the hinterland – was demarcated as critically polluted, requiring urgent intervention.
Ironically, the Asan tree from which the 19th-century town took its name is hard to find today, even in the handful of remaining forested patches in the Asansol Durgapur region. Like the missing Asan trees, Asansol and its hinterland reveal much more about what the CEPI misses than what it captures. It demonstrates how the government’s approach towards environmental conservation through the CEPI index is deeply flawed. The impact of this oversight is not written in words; it is written, instead, in the bodies of those who live and toil here, in the trauma of lost habitats, chronic respiratory diseases, allergies and ailments, of which there is no registry or database.
Comprehensive or incomprehensible?
The first effort to identify critically polluted areas (CPAs) in India was jointly undertaken in 1989 by the central and state pollution control boards. While 24 industrial hubs were identified as critically polluted that year, no holistic quantitative index (specifying various types of pollution, their levels and a combined score) was developed till 2009, when the Central Pollution Control Board (CPCB) – a statutory organisation under the Ministry of Environment, Forests and Climate Change – collaborated with the Indian Institute of Technology (IIT) Delhi and other institutes to evolve the Comprehensive Environmental Pollution Index.
The CEPI 2009 scorecard released in January 2010 laid down three sets of parameters to evaluate the environmental pollution score of an area, expressed on a scale of 0-100, with high scores indicating high levels of pollution. They comprised pollutants (including the presence of toxins and industrial activities), pathways (meaning ambient pollutant concentration and any evidence of adverse impact on people and eco-geological features), and receptors (indicating the potentially affected population, level of exposure and additional risk to sensitive receptors, including people, archaeological sites and ecological habitats.) The index was first developed in 2009-2010 to evaluate pollution levels in 88 industrial clusters selected by CPCB in consultation with the environment ministry, state governments and pollution-control boards. The score for 43 industrial clusters including Asansol exceeded 70, indicating they were critically polluted. Consequently, the establishment of new industries and expansion of existing facilities were banned in these clusters. State governments and pollution control boards were tasked with implementing a variety of mitigation measures, including the collection of penalties from polluting industries.
“Although many of the places demarcated as ‘polluted’ comprise urban agglomerations with a high concentration of heavily polluting industries, no CEPI score is available for the areas around them from which factories draw their raw material.”
CEPI placed scorecards for polluted industrial areas in the public domain on three more occasions – in 2011, 2013 and 2018 – when the number of ‘polluted industrial clusters’ spiked to 100. The reports of all four exercises, however, show a major shortcoming – although many of the places demarcated as ‘polluted’ comprise urban agglomerations with a high concentration of heavily polluting industries, no CEPI score is available for the areas around them from which factories draw their raw material.
In many cases, such surrounding areas have a large number of mines, including open-cast pits that cause irreversible damage to the environment. But instead of assessing environmental quality over a large geographical area or region, CEPI seems focussed on urbanised industrial clusters at the micro-level. This is evident in the way the index has been used in the Asansol Durgapur Development Area.
Asansol and Durgapur are the two largest urban agglomerations in the development area with their own municipal corporations; separated by a distance of 40 kilometres along National Highway-2, each has a steel plant and several sponge iron, cement and chemical factories and underground coal mines. While CPCB identified Asansol as ‘critically polluted’ in 2009, Durgapur was identified as ‘severely polluted’ in 2013. However, the hinterlands of these cities, where a large number of open-cast coal mines are located, were not even assessed. This corroborates what the Centre for Science and Environment (CSE), a New Delhi-based public-interest research and advocacy organisation, found in its analysis of the CEPI evaluation: areas where mining is rampant, like Bellary in Karnataka and Jharia in Jharkhand, were not included in the assessment.
Inventory of loss
Standing in front of his small hotel located about 5 kilometres away from the Sonpur Bazari open-cast coal mine in the Durgapur subdivision, Sekhar Das told me, “This area was densely forested till even a few years ago. In fact, through the 1980s and 90s, we used to avoid coming this side because we thought it was infested with ghosts. Even now, local residents refer to this area as ‘bhootbangla’.” Today, barren land was all around us and it was difficult to even sight trees and shrubs. Opposite the hotel, on the other side of the road, trucks were making their way in and out of a field that served as a fly-ash dump, and chimneys of brick kilns dotted the skyline on all sides.
Residents said the area began to lose forest cover after 1995, when the government-owned Coal India Limited subsidiary Eastern Coalfields Limited (ECL) received approval for the Sonpur Bazari OCP (open-cast pit) with a targeted output of 3.0 million tonnes of coal per year. Environmental clearance to extract 8 million tonnes of coal per year was granted in 2006. In 2013-14 – the same year when Durgapur city, located 30 km away, was identified as ‘severely polluted’ – its targeted output was sought to be hiked to 12 million tonnes per year. The area has lost all its forest cover in the intervening years.
Residents of villages near the Sorsetoli open-cast mine shared a similar story; they said the area was thickly forested till the early 2000s, and adivasis who lived in the forest hamlets depended on forest produce for their survival. An article published two years ago in Bhumadhyasagar, an Asansol-based Bengali periodical, also recalled the lush forests that were destroyed by the open-cast coal mine. Written by a young girl who had witnessed this change, and whose family had lost land and was rehabilitated, it agonised not only over the loss of forest cover and habitat but also people’s sense of identity and ‘rootedness’.
“Their numbers spiked in the years following economic liberalisation, coinciding with the rising participation of private entities in mining.”
Although open-cast coal mines existed in the area prior to the 1990s, they were far fewer in number and limited in scale as the focus was on underground mining. Their numbers spiked in the years following economic liberalisation, coinciding with the rising participation of private entities in mining. “The cost of extracting coal from underground mines is very high, apart from limitations on how much coal can be extracted at a given time,” explained a high-ranking officer in Coal India’s Kolkata office, requesting anonymity. “The demand for inferior coal, which is accessible through open-cast mining, has also spiked over the past two decades owing to the power crisis. Besides, it is also easier to extract good quality coal found deep beneath the earth through open-cast pits,” he said.
Officials at Coal India’s environment division said that in all cases where there is loss of forest cover due to mining, compensatory afforestation programmes are strictly implemented by the leaseholders of mines. “Since 2012, we have also been segregating the topsoil while digging pits, so that it can be replaced after backfilling,” said an official. Topsoil is necessary for vegetation, and while open-cast mines have been criticised for leaving behind barren land, the official insisted that replacing the topsoil after backfilling and undertaking plantation on the plot would allow forests to regenerate over five to ten years.
Field executives of ECL at work in the Sonpur Bazari open-cast mine, however, dismissed the official’s claim as impractical. “It’s not as if the entire mining area is dug up at one go – we dig a patch, dumping the overburden on one side, extract the coal, and fill up the trench with overburden from the adjacent patch taken up for extraction,” said Monojit Mondal, pointing out how the process was unfolding in the pit we were in. “How can we segregate the topsoil amidst all this, and where can we store it?” he asked, stressing that although his grandfather and his father had both worked in coal mines in the region, they had never seen forests growing back after mining activities in the area had ceased.
What the satellites say
The CPCB claims that the CEPI “captures the various health dimensions of environment including air, water and land”, and it is “intended to act as an early warning tool which… can help in categorising industrial clusters/areas in terms of priority of planning needs for interventions”. A closer look at the impact of mining and industrial activity on the environment across the Asansol Durgapur Development Area as shown in satellite imagery, however, reveals that these claims mean little on the ground.
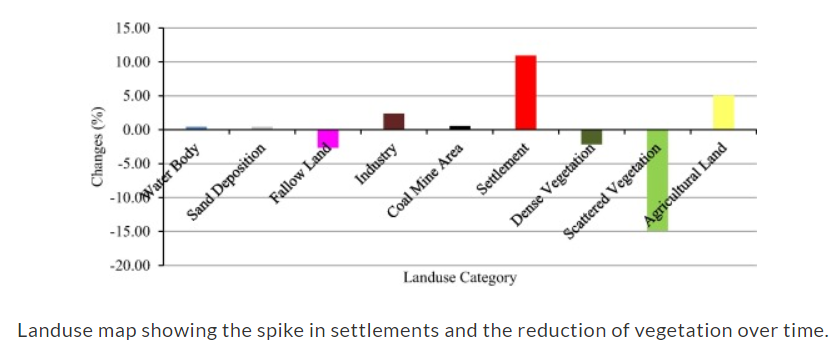
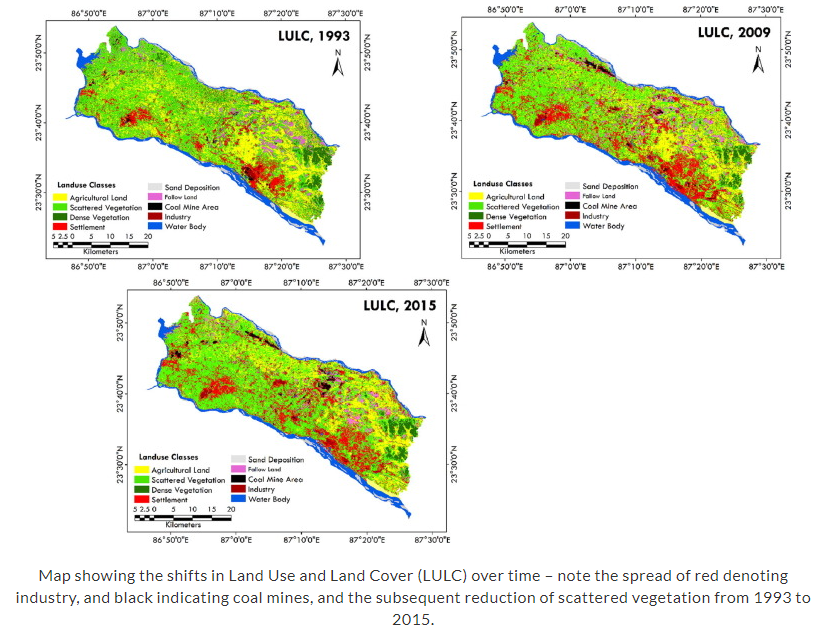
Several new open-cast coal mines in the Asansol Durgapur Development Area have been approved in the last ten years since Asansol, and later Durgapur, made it to the list of critically/severely polluted areas, according to an industry official. The cumulative impact of these mines and other related industries on the environment is captured in a satellite-image-based study of land use and land cover changes in the Asansol-Durgapur region between 1993 and 2015. The study by Deblina Choudhury, Kalikinkar Das and Arijit Das from the Department of Geography, University of Gour Banga, found that mining was the biggest contributor to changes in land use and land cover in the region during the period.
Although the total area occupied by coal mines remained small – it had increased from 0.89 percent to 1.43 percent between 1993 and 2015 – their impact was spread over a large radius. Land use maps prepared by the researchers using data from United States Geological Survey show there was a significant depletion in forest cover around new open-cast mines, such that “in this region, vegetated areas are rapidly turning into coal mine areas” – whereas the area occupied by dense vegetation in the region dropped from 6.9 percent to 4.7 percent between 1993 and 2015, areas with scattered vegetation shrunk by almost half from 43.2 percent in 1993 to 28.4 percent in 2015.
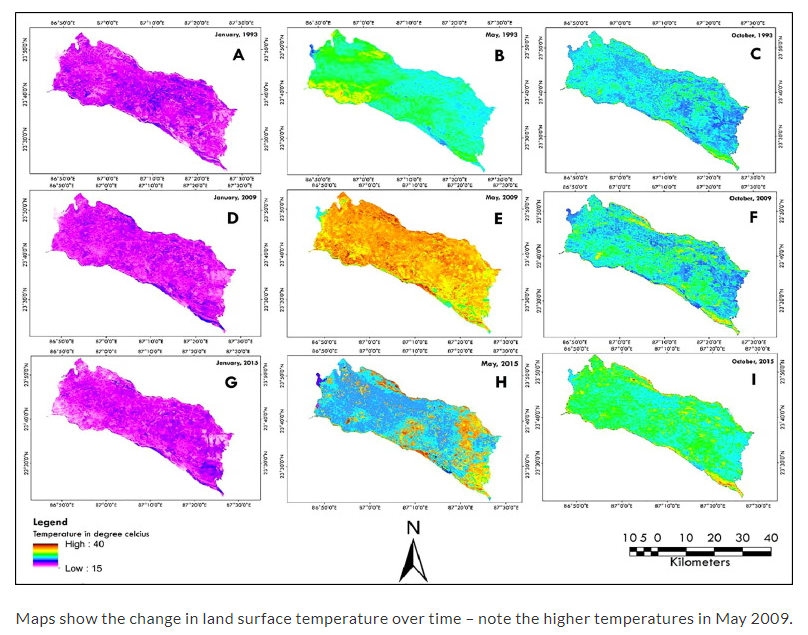
“Land surface temperatures in the region increased by two to four degrees between 1993 and 2015, and a strong correlation existed between land use and land surface temperatures, indicating the ecology and habitat of the region was under severe threat.”
The maps show that these areas also witnessed a sharp rise in conversion of fallow or forested land to agricultural land, the reasons for which were explained to me by the residents of villages around the Sonpur Bazari, Bhanora and Gourangdih mines. “We had to abandon our farmlands close to the mining site after runoffs from the overburden inundated them during monsoons, rendering them barren,” they said. “We had no option but to find farmland farther away from the mine.”
Land use and land cover maps from the study also show that areas around new open-cast mines located outside municipal corporation limits witnessed a spike in the built-up index (concretised buildings and roads); urban settlements also sprang up or expanded around new sponge iron and cement plants, pushing up the area covered by concrete settlement in the region from 9 percent to 20 percent.
The study found that land surface temperatures in the region increased by two to four degrees between 1993 and 2015, and a strong correlation existed between land use and land surface temperatures, indicating the ecology and habitat of the region was under severe threat. Sadly, the government’s approach to environmental conservation through CEPI, which CPCB claims is an “early warning tool”, fails to factor in such data, satellite images and GIS maps, leaving citizens in these regions in the dark about the threats facing them.
Human impact
Back in 2009, when my father, a resident of Asansol, was diagnosed with a chronic respiratory disease, we pinned the blame on his smoking. But conversations with several doctors in the region in subsequent years revealed that a large proportion of their patients, including those who had never smoked or used coal-fired chulhas (stoves), suffered from chronic respiratory diseases. Doctors reckoned that high levels of industrial and vehicular pollution were behind the prevalence of such diseases.
Their observations resonate with the findings of a study titled ‘Community Issues in Coal Belts’ conducted by the non-profit research and community development organisation Environics Trust. The study cited data from the Human Development Report of Paschim Barddhaman District, within which the Asansol Durgapur Development Area falls, to show that people in the coal-mining and industrial belt suffered from poor health. A team from the organisation visited the Asansol-Durgapur region for fieldwork in 2015-16; in a blog post, they said, “When we interacted with several medical practitioners in coal belts of Asansol and Angul (in Odisha), respiratory diseases topped the diseases known across these coal belts.” The study also cited a report of the now disbanded Planning Commission’s working group on disease burden for the 12th five-year plan (2012-2017), which notes that respiratory diseases are a direct consequence of industrial pollution.
There is no central registry outlining the disease burden, however, as government hospitals and health centres do not collect data on chronic respiratory diseases. This points to the need for frequent, more rigorous screenings of local communities in polluted areas for diagnosis and treatment, the blog post noted.
While government intervention towards environmental conservation bypasses health indicators due to lack of data and other reasons, the 2018 audit report of the Comptroller and Auditor General (CAG) of India on pollution in West Bengal reveals that even the mitigation measures outlined under the CEPI framework are not being implemented, placing people in such areas under greater threat.
The report, which looks at performance of pollution-control bodies in West Bengal between 2012 and 2017, notes that the West Bengal Pollution Control Board had not even prepared a Zoning Atlas for the state. Such an atlas, which both categorises the environmental quality by district and uses mapping to visualise possible alternate sites for industries, is the first step to prevent pollution. The report notes that heavily polluting industries were set up in critically polluted areas of Durgapur, Asansol and Haldia in violation of the state’s siting policy, and the policy did not consider ecologically sensitive areas that were to be avoided while setting up industries.
“The Remedial Action Plans of three Critically Polluted Areas (Haldia, Howrah and Asansol) were not implemented. The action plan for the Severely Polluted Area (Durgapur) was yet to be prepared,” said the report. Third party audited air quality reports revealed that in Howrah, Asansol and Durgapur, particulate matter (PM) of both 2.5 and 10 micrometres exceeded permissible limits, leaving inhabitants of the area highly susceptible to high blood pressure, heart attack, stroke, chronic respiratory diseases and other ailments.
The cumulative effect of such lapses was evidenced partially in January 2019, when the National Clean Air Programme (NCAP) included Asansol, Durgapur and Raniganj – another industrial town within the Asansol Durgapur Development Area – in a list of 102 cities (the list was later revised to 122) that had failed to attain the national standard on ambient air pollution.
Litany of lapses
The CEPI 2009 report made it clear that published scores were only a starting point for addressing pollution. As a second step, the report recommended spatial and temporal data analysis for the areas identified as critically polluted, in order to assess eco-geological damage to the landscape, and define clear boundaries for these areas. There would then need to be structured consultation with stakeholders in order to ascertain which plans or policies would be effective.
While there is little evidence that such temporal and spatial data analysis was conducted, signs that the CEPI framework was being bypassed emerged within months of the publication of the first report in January 2010. In October that same year, the moratorium on setting up new industries was lifted from five critically polluted areas. The moratorium was similarly lifted from 31 other critically polluted areas including Asansol in 2011, with the environment ministry arguing that works mentioned in the mitigation action plans submitted by states had already been initiated.
“In effect, this resulted in a further watering down of the already flimsy CEPI framework.”
In 2016, CPCB revised the CEPI framework, “eliminating the subjective factors but… retaining factors which can be measured precisely.” Parameters like potentially affected population, an impact assessment on health due to the presence of pollutants, and eco-geological features were dropped since they were difficult to measure objectively, while other parameters like status of ambient environment quality, health-related statistics relating strictly to pollution-related diseases (drawn from 3-5 major hospitals) and compliance status of industries were introduced.
In effect, this resulted in a further watering down of the already flimsy CEPI framework. While the revised algorithm emphasises ‘objective data’ like health statistics, there is simply no centralised registry of people suffering from chronic respiratory diseases, tuberculosis, allergies and other pollution-related ailments that can be used to compute scores.
Data on the status of ambient environmental quality, including that of air, surface water and groundwater, is also mostly unavailable. In fact, the CPCB directed all state pollution control boards in April 2016 to set up new real-time air and water quality monitoring stations that could make such data available. Most states dragged their heels and failed to set up monitoring stations as per the requirement despite several reminders from the CPCB. The 2018 Comptroller and Auditor General (CAG) performance audit report of pollution control agencies in West Bengal noted that the state pollution control board had failed to set up new real-time air and water quality monitoring stations in Asansol, Durgapur and two other critically polluted areas in the state.
The CPCB has been directed to collect more comprehensive data. In 2018 the National Green Tribunal, a statutory body mandated with providing speedy environmental justice and reducing the burden of litigation in higher courts, took suo motu cognisance of lapses in several states based on a news report. In a July 2019 order, it directed the CPCB to compile data on water, air and other pollution within three months, in addition to computing a comprehensive score. “Compiling data for categorising areas as polluted based on water pollution or air pollution or other pollution alone may be a step in the right direction,” it observed.
While no data on water, air and other pollution has been placed in the public domain yet, on the ground, businesses seem to face no hurdles in establishing new ventures very close to industries which create high levels of pollution. Residents near the Sonpur Bazari OCP on the outskirts of Asansol pointed out that a leading industrialist had purchased a huge plot in the area to establish a rod factory. That it was located only two kilometres away from a massive open-cast mine and that necessary clearances for the plant might be difficult to obtain seemed to matter little.
Meanwhile, the environmental conservation measures initiated under the CEPI framework – like installing pollution control and monitoring devices, preparing zonal maps and siting policies for industries – seem to be unfolding in Asansol and its surroundings in complete ignorance of local ecology. The LED panels that display daily pollution data in front of the railway station and the court premises best illustrate this detachedness.
Attached to air quality monitoring stations located in the heart of the city, the panels were installed as part of CEPI-led efforts to monitor and tackle environmental pollution. They prominently display the levels of particulate matter (PM, 2.5 and 10 micrometres), sulphur dioxide, carbon monoxide and ammonia in the air that day.
Few people in the city know what they mean, what the permissible limits are, or how they might be impacted by the excessive presence of such pollutants in the air over long periods of time. The mere presence of these panels and the bold, prominent display of alphabets and numbers, though, seems to convey that all is well.
This article was published in Himal South Asian.